The Risk Type Compass™ 2019 Report Updates
Recent technological advances have enabled us to improve the design of the Risk Type Compass™ Personal Reports. This will provide users with even greater insight into risk-related personality. A sample of the new 2019 Report can be found here.
The current paper will explore the implications of these new report features by focussing on the psychometric properties and potential applications of the newly-improved assessment.
Before exploring these advances, we will give context by providing a brief introduction to the Risk Type Compass™ and its development. For a more in-depth breakdown of the development process and potential applications of the Risk Type Compass™, read our Technical Manual.
Development of the Risk Type Compass™
The Risk Type Compass™ resulted from our efforts to understand personality through the lens of risk. This process began by writing dozens of items reflecting various risk-relevant elements of the Five Factor Model of personality.
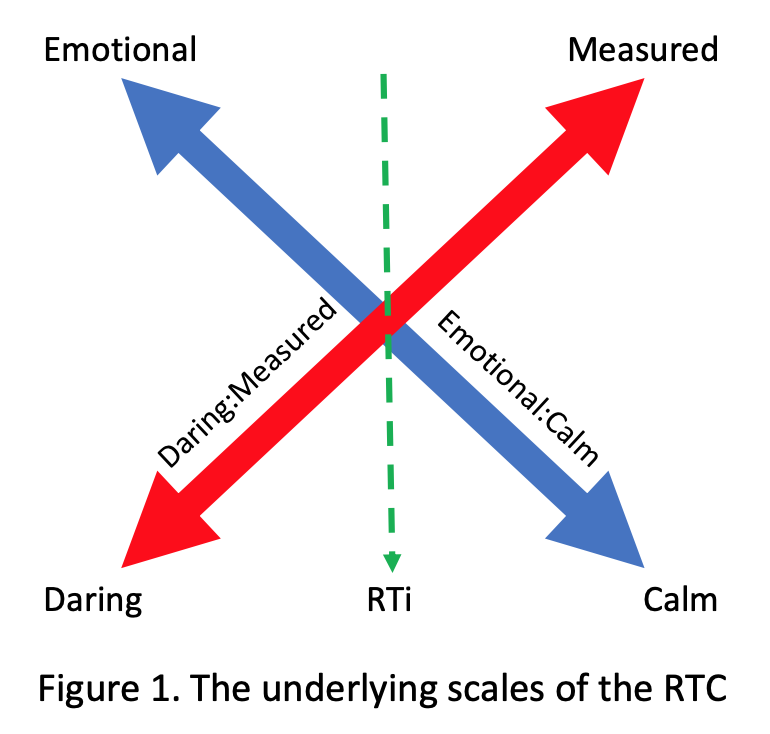
This resulted in 18 sets of four-item subthemes. Further analysis indicated that these subthemes loaded onto four factors that formed two orthogonal bi-polar scales: the ‘Emotional:Calm’ and ‘Daring:Measured’ scales.
Completing the Risk Type Compass™ assessment generates 18 subtheme scores, resulting in scores for the Emotional:Calm and Daring:Measured scales. These scores are compared against our norm of 10,000 individuals to identify scale scores. They are also combined to generate the participant’s Risk Type and RTi.
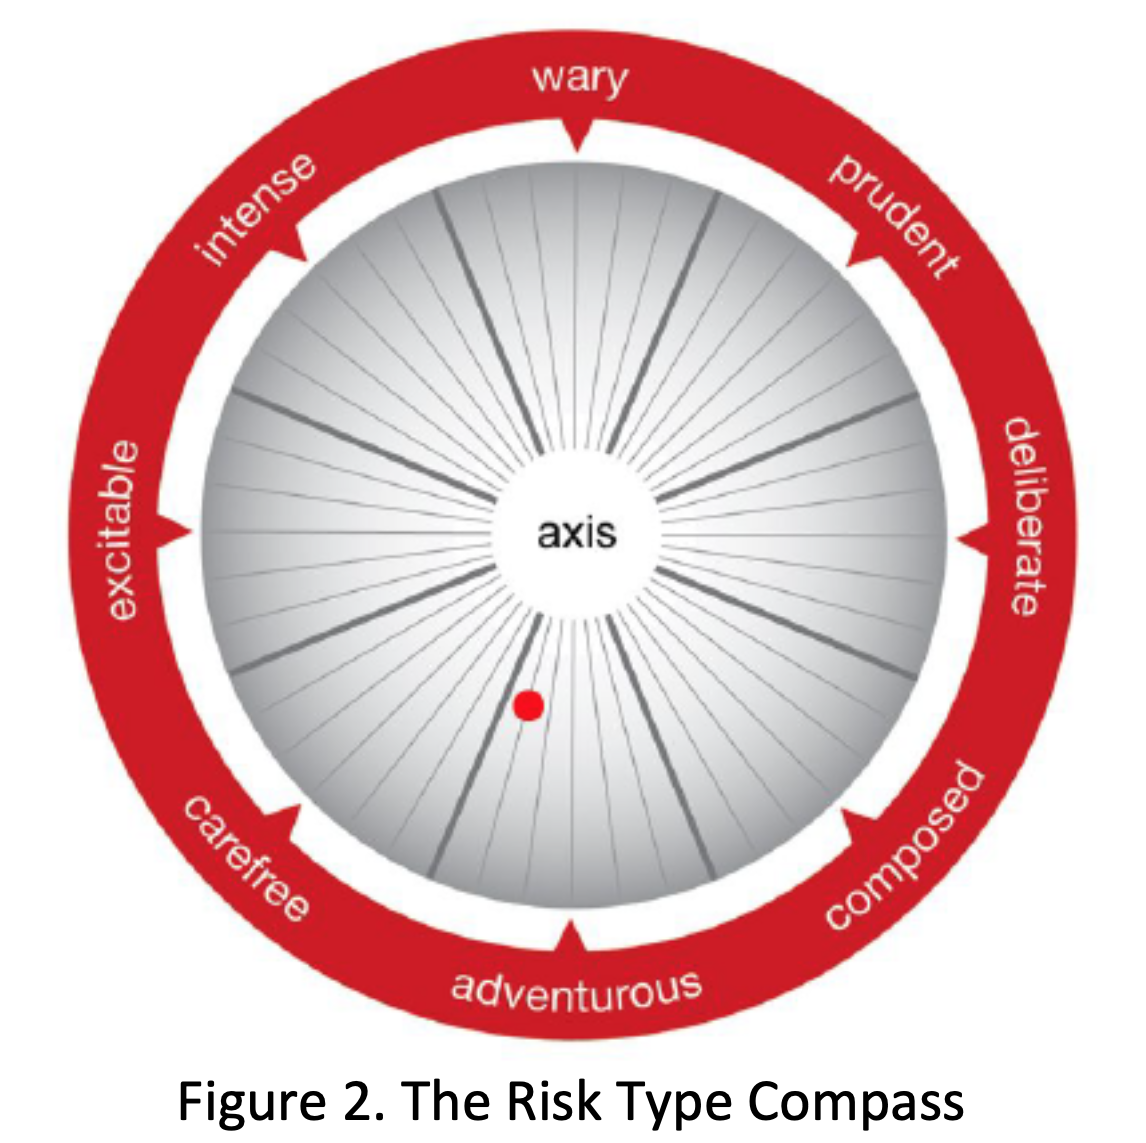
The format of feedback does not end with Risk Type. There are over 200 potential locations on the Compass graphic, and both proximity to neighbouring Risk Types and to the perimeter of the Compass can provide additional personality narrative.
Despite this existing nuance, recent developments in report design have enabled us to delve even further into an individual’s personality.
New Report Features
The multiple improvements reflected in the new report fall into two broad categories: the additions of scale-level and subtheme-level feedback.
Scale Feedback
The first development of note is the report’s inclusion of scale scores. The unchanged RTi metric provides an overarching perspective on an individual’s risk tolerance using a linear spectrum. However, reports will now provide feedback on where the participant scored on the two underlying scales, as shown in Figure 3. below.
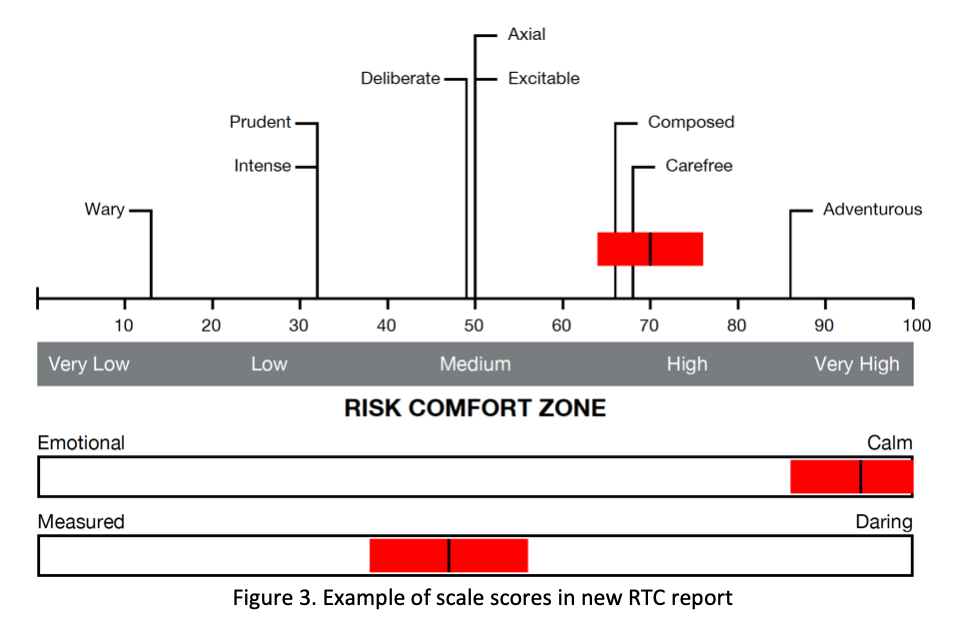
Scale-level feedback not only adds to the RTi, but it can enhance it too. The RTi is a product of these two scales and will sit between them. Scale-level feedback will now enable the user to perceive RTi placement in the context of scale alignment. This understanding begins with recognising what these scales represent.
The Emotional:Calm scale is concerned with the emotional elements associated with decision making. It plots an individual’s tendency to be emotional, apprehensive and anxious at one end of the scale, or calm, confident and resilient at the other.
The Daring:Measured scale is concerned with the cognitive elements associated with decision making: caution, preparedness and need for certainty; and the extent to which an individual needs the reassurance of familiarity, clarity and knowledge. The other end of the scale identifies those who are impulsive, flexible and happy to work with ambiguity and uncertainty.
Location on these scales is determined by the Risk Type Compass™ norm group of 10,000 participants. Analysis of scale-level data indicates a negligible correlation between the two, suggesting that, despite being highly influential in the context of risk tolerance, these scales can be considered independent of one another.
Another noteworthy report addition illustrated in Figure 3. above is the red bar centred around scale placement. The width of these bars is meaningful, as they represent the Standard Error of Measurement (SEM) of each scale. The SEM is the standard deviation of observed test scores for a given ‘true’ score and indicates the degree of confidence a user can have around the accuracy of a participant’s score.
By providing additional scale-level feedback, the new Risk Type Compass™ reports offer improved context to existing Risk Type and RTi metrics.
Subtheme Feedback
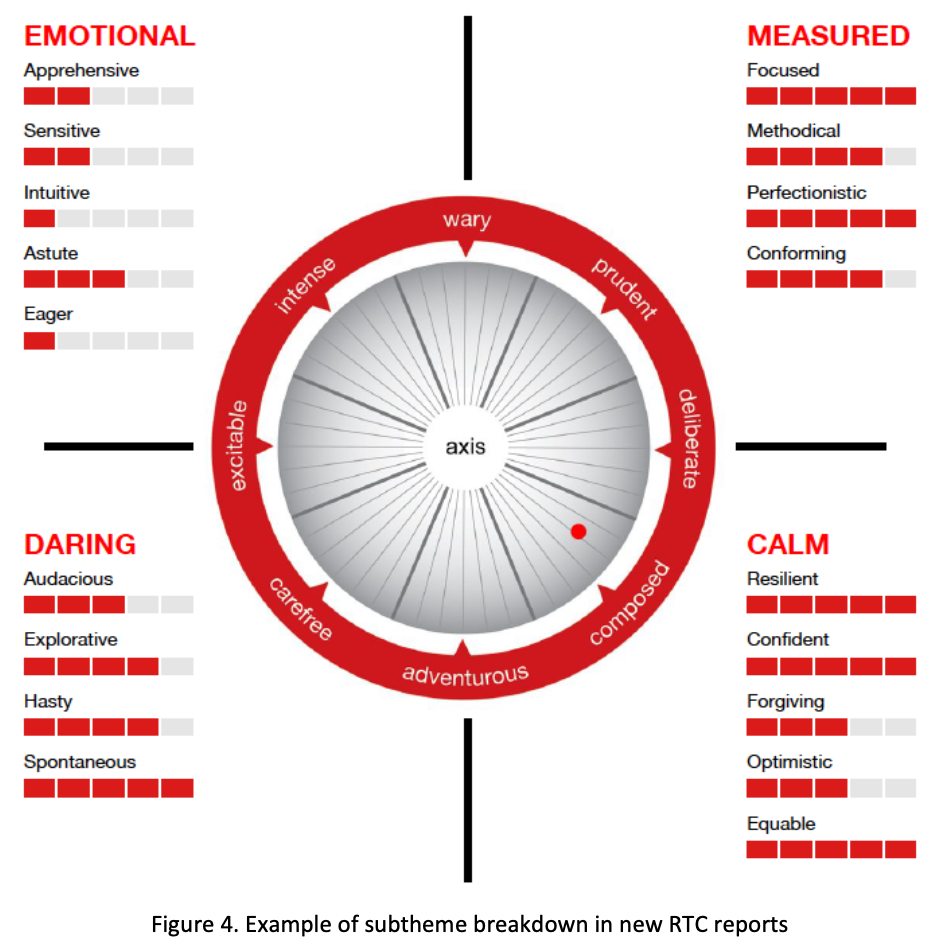
The second overarching improvement to the Risk Type Compass™ Personal Reports is the addition of subtheme-level feedback. Subtheme scores are presented in blocks of five and are grouped in the Report using the factor structure. In our newly-designed Reports, this information is displayed as follows:
This format is a marked improvement. It enables far greater insight into the various intricacies of risk personality derived from the assessment.
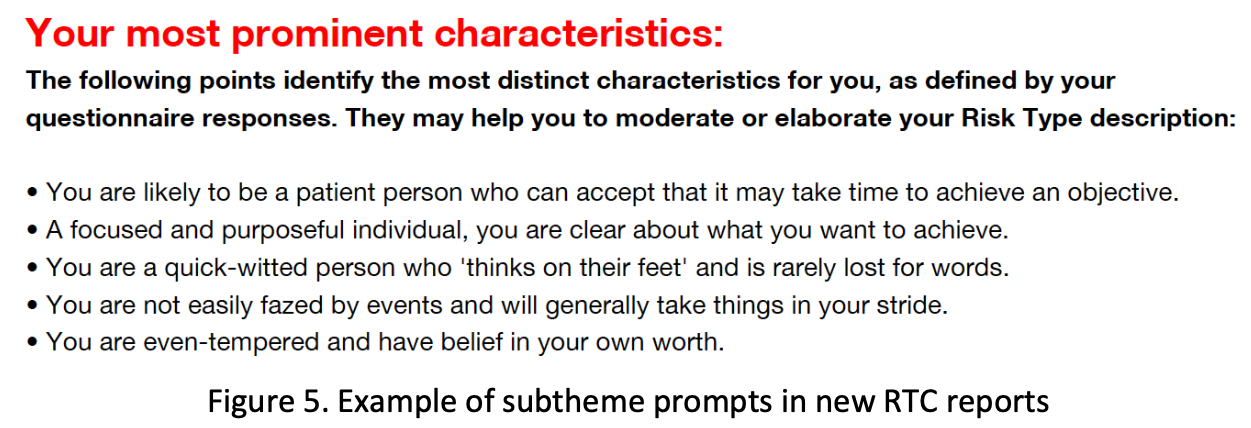
The graphical representation of subtheme scores is supplemented by a section examining the participant’s most prominent characteristics. The result is a bespoke series of prompts that provide additional narrative insight.
As with scales, subtheme blocks and prompts are determined using the Risk Type Compass™ norm group. This means that the resulting insight is not only nuanced but contextualised using a large sample.
These developments place considerably more information into the hands of users. As with any psychometric, thought must be given to the reliability and validity of the data. Information on these areas will now be provided.
Reliability
In psychometrics, reliability refers to the overall consistency of a measure. The goal is to create and administer measures that produce similar results under consistent conditions. Test retest is one approach to measuring reliability and is achieved by comparing two scale scores obtained from the same individual at two different points in time.
For reference, we use the European Federation of Psychologists’ Association’s (EFPA) test review framework. This is the framework used to conduct the independent reviews presented on the British Psychological Society’s Psychological Testing Centre and is commonly used throughout Europe. The EFPA review criteria scores reliability coefficient strength as follows:
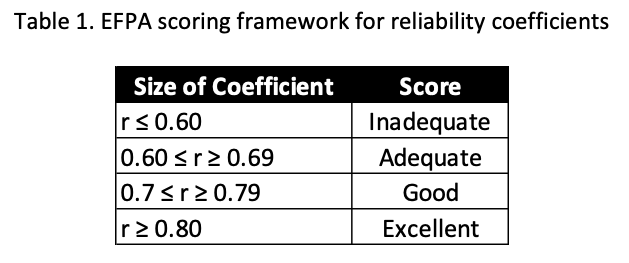
With this framework in mind, what are the reliability coefficient strengths of the Risk Type Compass™ measures presented in the new reports?
Scale Reliability
In 2018, we reported the exceptionally high test retest reliability at scale level for the Risk Type Compass™. Since then, these findings have been replicated in a sample size that has nearly doubled, now sitting at 242 individuals. The findings of this analysis are in Table 2. below.
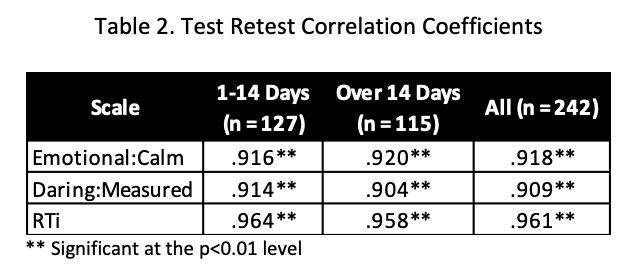
The Emotional:Calm and Daring:Measured scales now reflect correlation coefficient strengths of 0.918 and 0.909 respectively. At the RTi-level, a test retest correlation of 0.961 was reported. All findings were significant at the p<0.01 level.
It is also important to note that the ‘Over 14 days’ category reflected a high average of 189.1 days for the 115 participants. Correlation coefficients above 0.8 obtain an ‘Excellent’ EFPA score, meaning that all scales comfortably achieve this rating across both temporal categories.
Put simply, the two underlying scales and the Risk Type that they generate represent exceptionally reliable metrics, and this reliability is stable over potentially long periods of time.
Subtheme Reliability
Whilst exceptionally high, it is important to note that the Emotional:Calm and Daring:Measured scales encompass ten subthemes (40 items) and eight subthemes (32 items) respectively.
In contrast, each subtheme only encompasses four items. This reduction in items is likely to contribute to a reduction in reliability, but the question is how much? Table 3. below provides the test retest correlation coefficients for each of the Risk Type Compass™ subthemes.
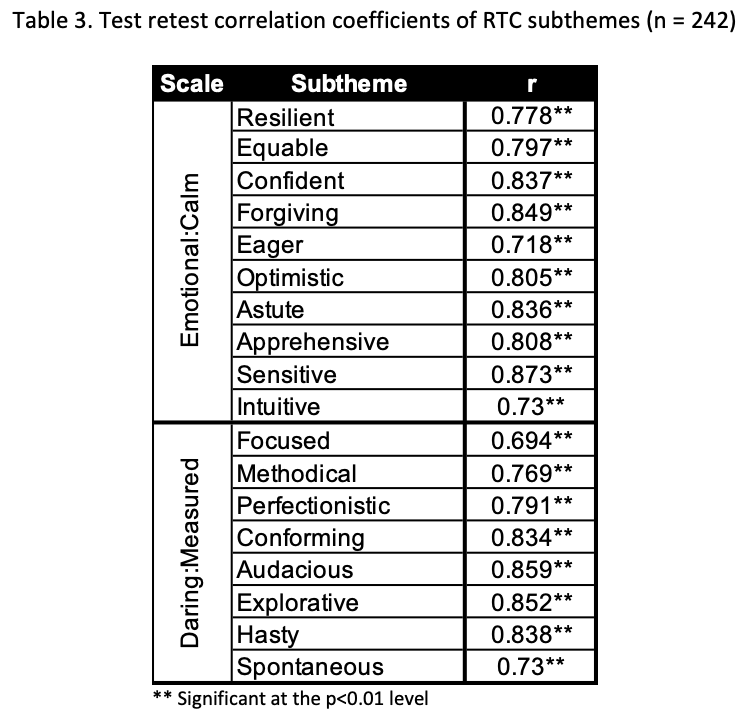
As predicted, the four-item subthemes obtained lower reliability correlation coefficient strengths than the larger scales that encompass them. However, all Risk Type Compass™ subthemes obtained an EFPA of ‘good’ (seven) or ‘excellent’ (ten). The exception was the Focussed subtheme, which just fell into the ‘adequate’ rating with a correlation of 0.694. All correlation coefficients above are significant to the p<0.01 level.
Recognising the reduction of reliability when moving from scales to subthemes is important in the context of application. Whilst the subtheme feedback illustrated in Figures 4. and 5. provide some highly beneficial nuance to users, a degree of caution should be exercised when focussing on these subthemes.
In practice, primary focus should be given to Risk Type and the Risk Type Compass™ scales, as these form the ‘big picture’ of the participant’s personality. This headline should then be supplemented with the nuance of subtheme-orientated feedback for greater understanding.
Having provided details on the consistency of scale and subtheme information, the paper will now move to explore a selection of studies that highlight the potential benefits of subtheme-level insight.
Validity
The Risk Type Compass™ benefits from a large and growing body of research content and case studies. The current paper will draw on a small sample of this content to explore how scale- and subtheme-level insight emerges from this work. This will help inform practitioner-led application of the Risk Type Compass™.
Resilience
Resilience has become an increasingly popular topic in academic literature and consultancy services. We explored the interaction between resilience and the Risk Type Compass™ in two separate research projects. The first focussed on 232 Mental Health Professionals and incorporated the 25-item Conner-Davidson Resilience Scale (CD RISC) and the second used the 6-item Brief Resilience Scale with a sample of 121 adults.
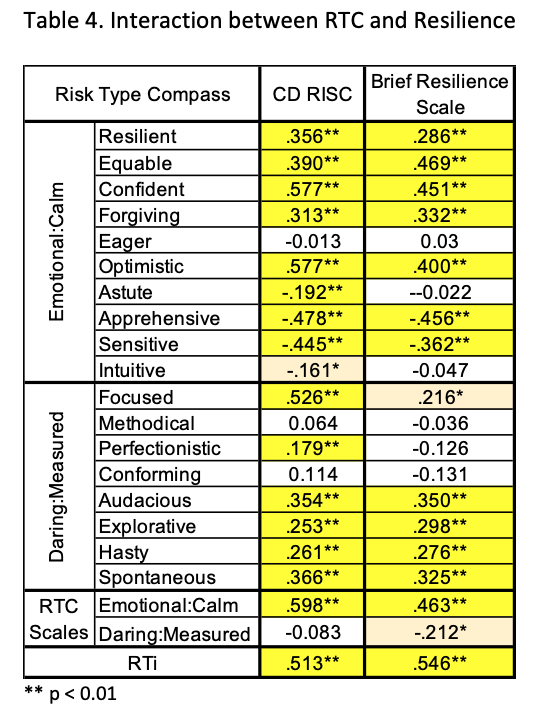
At scale level, the Emotional:Calm and RTi emerge as significant elements of the Risk Type Compass™. Several powerful relationships also emerge at subtheme level. Positive correlations were identified for Apprehensive and Sentimental. These findings indicate that users would be well-grounded when discussing potential resilience-related implications of relevant subtheme and scale scores.
Change Resistance
Our recently published white paper on resistance to organisational change indicated a strong relationship with the Risk Type Compass™. Risk Type was a significant predictor of organisational change resistance, although subtheme variation did exist. Table 5. below provides a breakdown at scale- and subtheme-level.
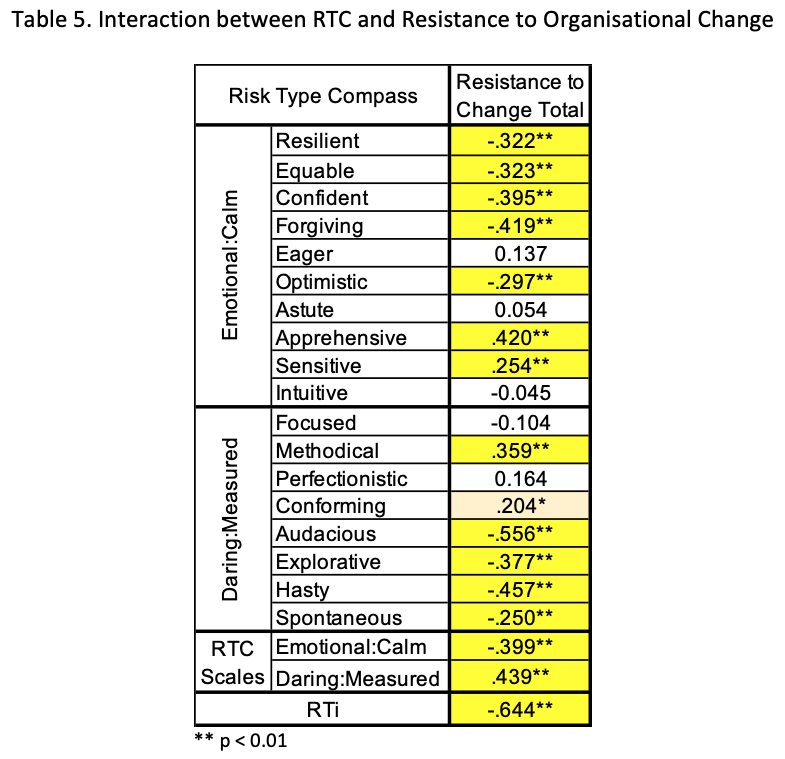
Both scales, and, by extension, the RTi, reflected significant correlations. At subtheme-level, the influence of anxiety (e.g. Apprehension, (-)Confident) versus attraction (e.g. Audacious, Hasty) to change emerges. This indicates that every ‘level’ of the Risk Type Compass™ could be drawn upon to discuss, predict and understand resistance to organisational change in the workforce.
Creativity
Taking a risk is a vital component of originality and, by extension, creativity. Our upcoming white paper focused on 85 participants employed in a variety of creative fields. One measure of creativity involved the Creative Achievement Questionnaire (CAQ) and the correlations between this and the Risk Type Compass™ are presented below.
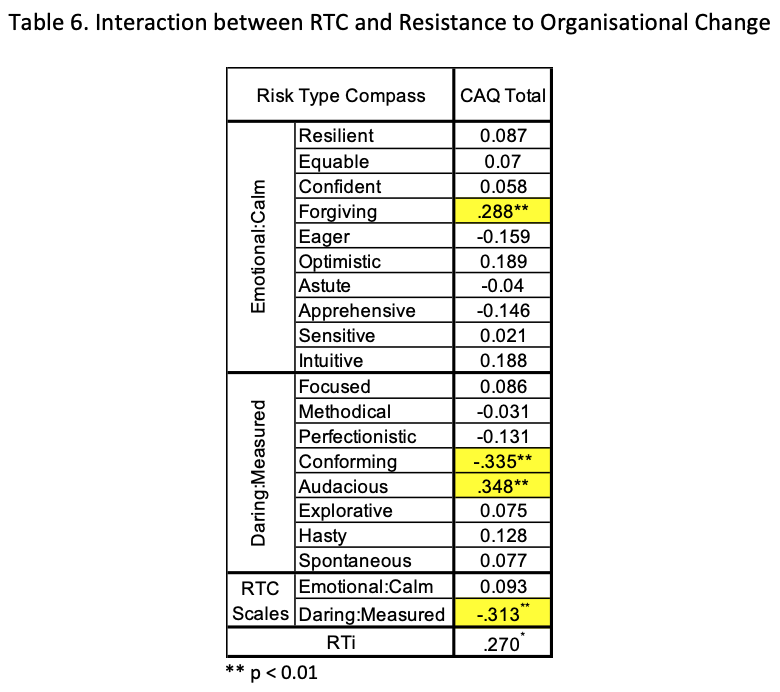
Findings indicated a relationship with the CAQ and the subthemes of Conforming and Audacious. These also contributed to a correlation with Daring:Measured. The result of the analysis suggests that creative individuals are less likely to be in awe of tradition or convention, and instead feel motivated to challenge the status quo with novel approaches. As always, downsides to these proclivities should also be considered, and the report’s subtheme breakdown will enable practitioners to address these in their feedbacks.
Agreeability
Highly agreeable individuals will typically be warm, friendly, compassionate and polite. They generally have an optimistic view of human nature and will value interpersonal relationships and team cohesion. Whilst not explicitly represented in the Risk Type Compass™ at subtheme level.
Research conducted with 105 legal representatives included a brief Agreeability scale derived from the International Personality Item Pool (IPIP), and the correlations of this scale are presented below.
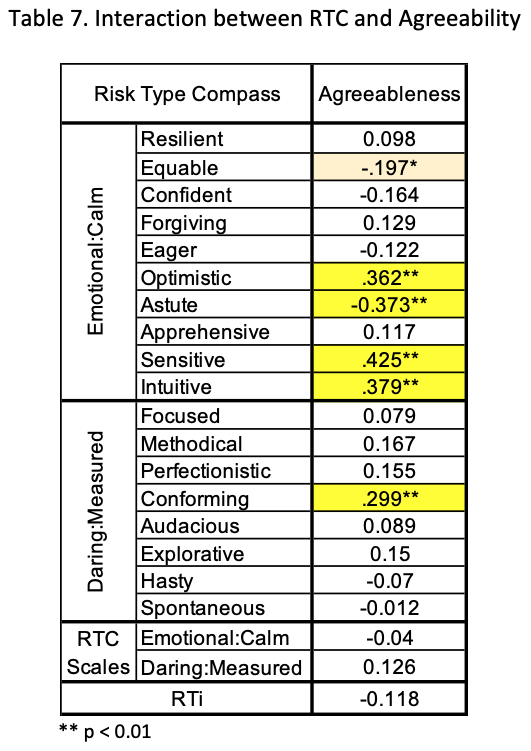
Findings confirmed our assumption that agreeability would not be sufficiently represented at scale level. But the factor did have some notable associations with several Risk Type Compass™ subthemes. These include positive relationships with the Risk Type Compass™ subthemes of Sentimental, Intuitive (-)Astute, Optimistic and Conforming. By providing subtheme-level feedback, the Risk Type Compass™ Personal Reports will enable users to probe context-specific inferences relating to Agreeability with their feedback.
Individual Task Adaptivity
The formats of work tasks vary greatly, and individual differences can manifest as preferences for these different formats. Some tasks may require flexibility and innovation, whilst others may demand rigidly following established processes. Our research with 121 participants included several facets of self-rated performance, and our findings for the Individual Task Adaptivity facet is presented below.
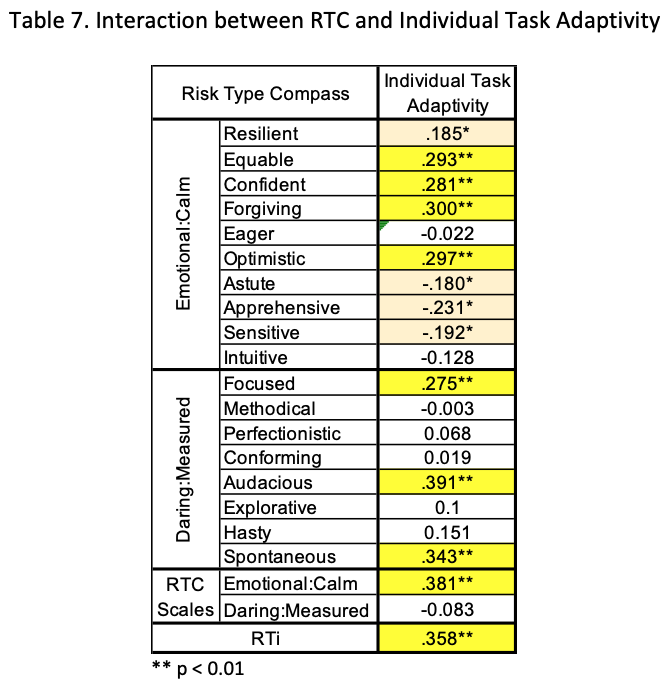
Analysis indicated some interesting relationships at subtheme and scale level. In the case of the former, Audacious and Spontaneous emerged as the most significant. This suggests individuals high in these areas relish novelty in their work and may become bored with repetitious routine. The scale-level finding indicates that participants scoring more closely towards the ‘calm’ end of the spectrum were more likely to report adaptive performance in times of volatility and uncertainty. The researchers define the factor as follows:
Individual Task Adaptivity: dynamic, unpredictable markets and rapidly changing technologies result in unanticipated changes to work requirements. This factor reflects the degree to which individuals cope with, respond to, and/or support changes that affect their roles as individuals.
In the context of application, subtheme- and scale-level metrics enable the practitioner to explore potential concerns with task format and workplace stability. Strategies for working in challenging environments can be tailored to individuals, and discussions can follow and be informed by the collection of relevant data.
Conclusion
This paper has introduced the reader to the new report improvements and their psychometric properties. It also touched on a small section of recent research in order to draw out various applications based on previous findings.
These not only demonstrate the large number of applications suitable for the Risk Type Compass™, but the increase in insight resulting from the recent improvements to report design.